The Whiteboard: Making Physician Reasoning work for AI
Healthcare AI fails not from lack of data, but from fragmentation. Each system sees a piece of data, no one sees the patient. Physicians reason in connected patterns, "Knowledge Graphs" formalize that reasoning, creating a unified, governed layer that lets AI see meaning, not noise.

If you've watched a crime show, True Detective, Mindhunter, any CSI episode, you know the scene. The detective stands in front of a whiteboard or corkboard covered in evidence. Photographs pinned down. A timeline scrawled in marker. And red string connecting everything: the suspect to the weapon, the weapon to the location, the location to the motive. The connections are the investigation. You don't need complex analysis to see the pattern. The relationships between pieces of evidence tell the story.
But here's the thing, that's what every physician is doing every morning.
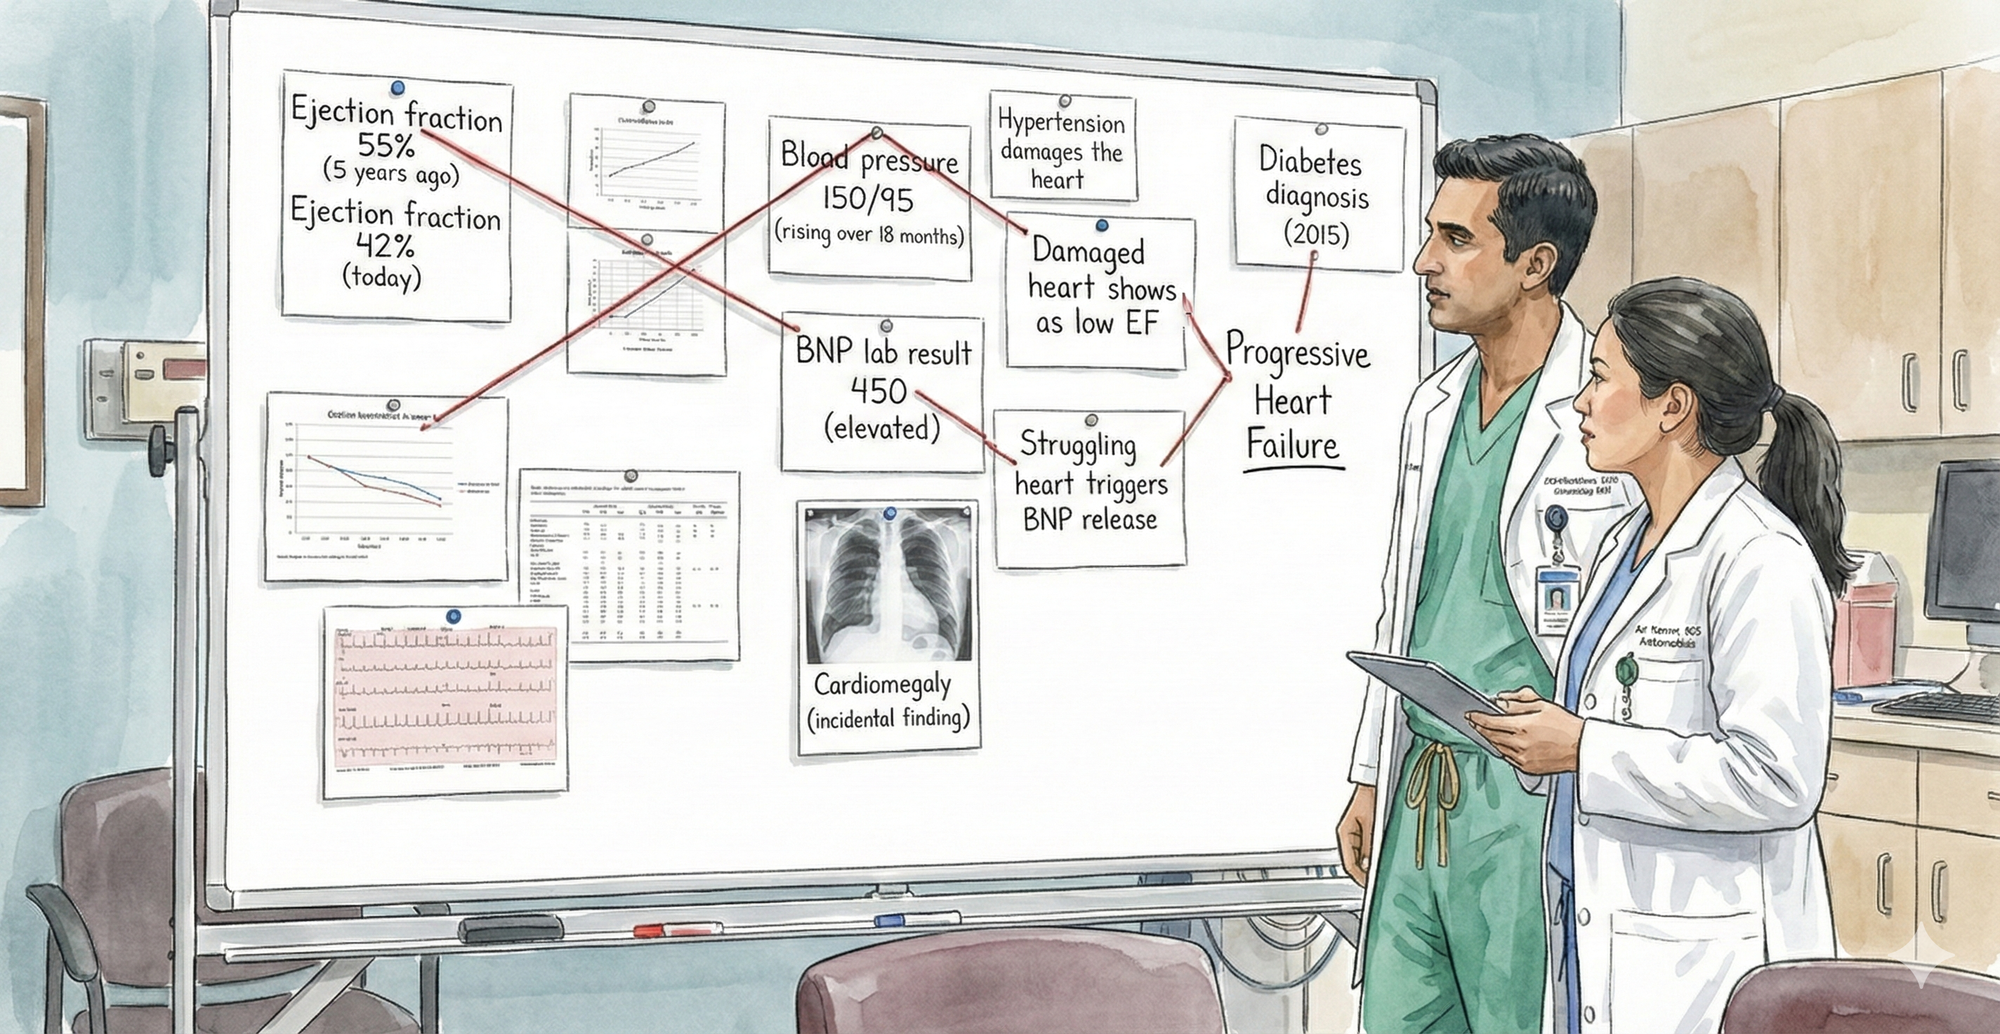
When you round on your patients, you're performing that same investigation in your head. A 55-year-old with declining ejection fraction (55% to 42% over five years), rising blood pressure, an incidental finding of cardiac enlargement on a chest X-ray, and elevated BNP. You instantly connect these: progressive heart failure, needs intervention now. You don't consciously think through each connection. Your brain does it automatically, because you've seen the pattern before and know which pieces relate.
That's clinical reasoning. That's the whiteboard in your head.
When you present that same case at grand rounds, you externalize that reasoning. You talk through the evidence and connections: declining EF plus uncontrolled hypertension suggests progressive systolic dysfunction; the chest X-ray finding of cardiomegaly corroborates it; elevated BNP confirms cardiac stress. A cardiologist might add a nuance you missed. A nephrologist might flag that some HF medications worsen kidney function. An intensivist might plan for acute decompensation. Each specialist sees different connections, knows which relationships matter for their domain. Together, the clinical picture becomes richer, more complete, more robust.
That's the power of externalizing reasoning. It makes it discussable, challengeable, improvable. It allows different expertise to converge on a problem.
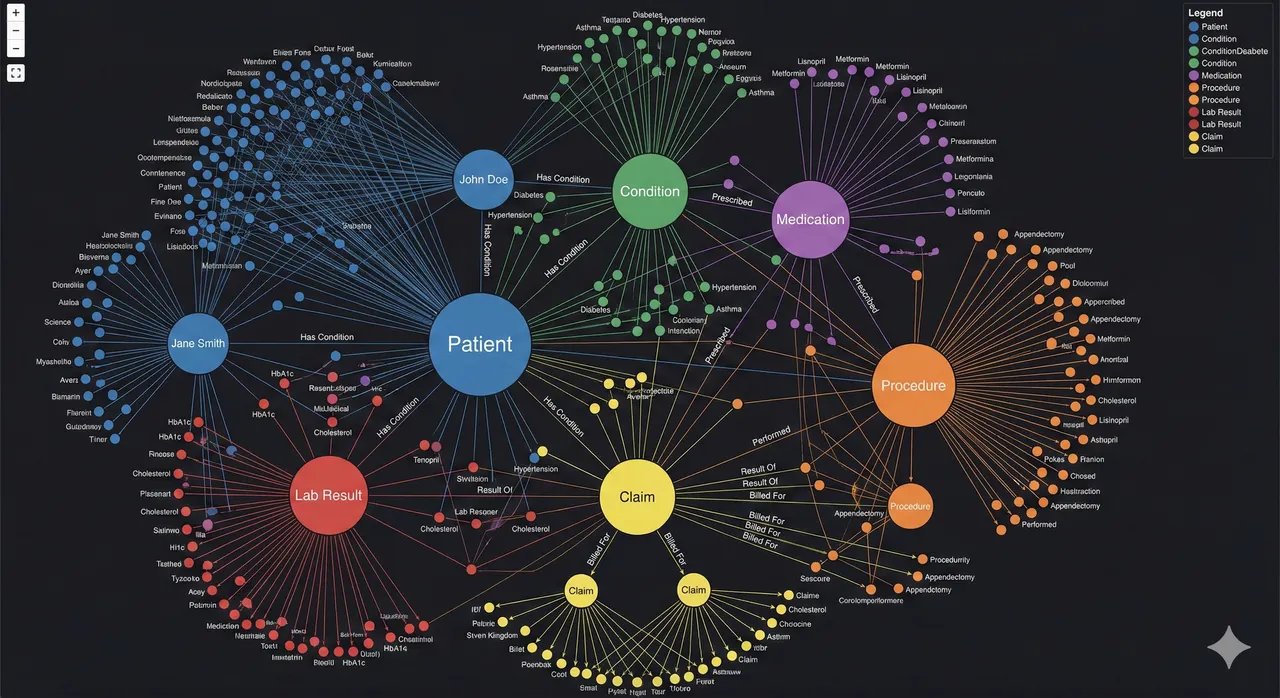
What you're actually showing on that mental whiteboard is a visual causal map. It connects entities, observations, and relationships: Hypertension damages the heart. Damaged heart shows as low EF. Low EF plus elevated BNP points to progressive heart failure. Diabetes contributes to progression. That structure, nodes plus labeled relationships, is exactly how a knowledge graph represents meaning.
But here's the difference. That board is manual, static, not machine-readable, not queryable, not governed by any formal structure. A true knowledge graph encodes the same reasoning in a computable way:
Patient → hasDiagnosis → Hypertension Hypertension → causes → CardiacDamage CardiacDamage → resultsIn → LowEjectionFraction LowEjectionFraction → associatedWith → ProgressiveHeartFailure
The key difference is operational. That whiteboard helps humans reason. A knowledge graph helps systems reason. You're looking at a cognitive knowledge graph, a clinician externalizing relational reasoning. A production knowledge graph is the same logic formalized, versioned, queryable, and auditable.
Clinicians already think in graphs. This isn't new AI. It's formalizing what physicians have done instinctively for decades.
Now scale that. Not five patients a week in grand rounds. Not your mental pattern recognition. Scale it to one million patients, to patterns too subtle for any single clinician to catch, to decisions at 2 AM when there's no specialist in the room. Scale it so an insurance investigator can catch fraud the way a detective catches a conspiracy, and so an AI system can do clinical reasoning reliably, consistently, auditably. That's where a knowledge graph comes in.
A knowledge graph is the externalized whiteboard of clinical reasoning. It's where the relationships that physicians see mentally, that teams discuss at grand rounds, become explicit, computable, and scalable. It's not a new way of thinking about healthcare. It's the same way you think about healthcare, just written down in a form that machines can reason about, that auditors can verify, that other specialists can interrogate and build upon.
But to understand why that matters, we need to look at what happens when clinical reasoning stays fragmented across different systems, different organizations, different minds. Because that's where the real problem lies.
The Fragmented Whiteboard: What Happens When Reasoning Is Scattered
But here's the problem. That unified reasoning, the whiteboard where all the connections are visible, only exists in one place: inside a physician's head, or temporarily on a whiteboard during grand rounds.
In the real world, that reasoning is fragmented across six different systems, six different organizations, none of which were designed to work together.
The Clinical Problem: The Pattern Disappears
Let's go back to your 55-year-old. The one with the declining heart.
A cardiologist at a clinic has the whiteboard in her head. She has the echocardiograms: EF 55% five years ago, now 42%. She sees the pattern. Progressive decline. She knows what it means.
But she doesn't have the incidental finding from the chest X-ray. The patient had pneumonia workup at a hospital across town. The radiologist noted "possible cardiomegaly" in the report. It was meant as a secondary finding, something to mention in a follow-up. But the cardiologist never saw it. The radiologist assumed the ordering provider would flag it. The ordering provider never did.
She doesn't have the BNP lab result. The patient went to an independent lab for blood work. The result came back elevated (450, normal is under 100). But the lab result is in a system the cardiologist doesn't regularly check. The patient might not have even told her about it.
She doesn't have the blood pressure trend. The patient's primary care doctor has been monitoring BP over 18 months. The readings are rising: 130/80 three years ago, now 150/95. But the primary care doctor doesn't know about the declining EF. They're managing hypertension in isolation, not knowing it's contributing to cardiac damage.
She doesn't have the diabetes context. The patient's endocrinologist manages the diabetes. The endocrinologist knows diabetes accelerates heart disease, but they don't see the echo results or the cardiomegaly finding.
The pieces exist. The evidence is there. But it's scattered.
So the cardiologist sees one part of the whiteboard: declining EF. That's concerning. She recommends a heart failure workup.
But she doesn't see what a detective would see immediately if all the evidence were pinned on one board: the connections that point to a patient in progressive decline who needs intervention now, not in six months. She sees the EF decline. She misses the corroborating evidence of cardiomegaly, elevated BNP, rising BP all pointing the same direction. So her sense of urgency is moderate, not acute. The patient gets scheduled for cardiology in two weeks instead of being admitted for urgent evaluation.
Six months later, the patient has chest pain. He goes to the ER. EF is now 35%. He spends a week in the ICU. He costs the payer $50,000. He costs himself his peace of mind, a week of hospitalization, and possibly permanent cardiac damage.
The pattern was visible. The data existed. The connections were logical. But they were on different whiteboards, in different buildings, owned by different organizations. So nobody connected them.
The Technical Problem: Systems Don't Even Know It's the Same Patient
But there's a deeper problem. Before you can even see the connections, you have to solve a seemingly basic question: Is the patient in the cardiology system the same person as the patient in the hospital system, the lab system, the primary care system?
It seems obvious to humans. It's the same 55-year-old man. But computer systems have no way to know that automatically.
- The cardiology EHR calls him Patient ID ECHO-98765. His name is listed as "Jon Doe." Date of birth: 05/15/1969.
- The hospital where he got the chest X-ray has him as Patient MRN 555-444-999. Name: "John Doe." DOB: 1969-05-15.
- The independent lab has him as patient "J. Doe," DOB 05/15/69, no ID number.
- The payer's claims system has him as Patient ID 12345. Name varies depending on which form was filled out.
- The primary care system has him as Patient ID 7789. Name: "John A. Doe."
- The pharmacy system has him as Patient ID PHARM-556.
Is ECHO-98765 the same person as 555-444-999? Probably. If you fuzzy match on "Doe" and "05/15/1969," you'd say yes. But maybe not. What if there are two John Does born the same day in the same city? What if there's a typo in one of the names?
And even if you match the patient correctly, the data is in different formats. The cardiology system measures EF as a percentage. The hospital system might call it LVEF. The claims system doesn't capture it structured at all. The lab reports BNP in one unit, maybe troponin in another. Blood pressure is recorded differently in different systems.
So when an AI system or an analyst tries to pull together this patient's data, they have to:
- Resolve which patient IDs refer to the same person (hard, error-prone)
- Map different vocabularies to the same concepts (harder)
- Handle different data formats (harder still)
- Manually stitch together the timeline (tedious, error-prone at scale)
- Connect unstructured findings (cardiomegaly buried in a radiology report) to structured data (EF trend)
And all of this has to work for millions of patients. One patient, one cardiologist can do it mentally. One million patients, no human can. So you build an AI system to do it. But the AI system is learning on fragmented, poorly harmonized, inconsistently formatted data. So it learns an incomplete picture. It might learn "declining EF is a risk factor for heart failure." But it almost certainly doesn't learn "the combination of declining EF plus cardiomegaly plus elevated BNP plus rising BP in a diabetic patient is a high-priority intervention signal."
The Governance Problem: Nobody Owns the Truth
But there's an even deeper problem. The fragmentation isn't just technical. It's governance.
Each system exists because a different organization needed it. The hospital owns imaging. The EHR vendor owns clinical data. The payer owns claims. The lab owns results. The pharmacy owns meds. Each optimized for their operation, not for the questions that matter: Is this patient safe? Is this claim appropriate? Is this diagnosis correct?
The consequences are structural. Nobody owns the longitudinal patient view. Data sharing is hard (HIPAA, consent, integration). Data quality is local and gaps stay hidden. Audit trails are fragmented. Bias detection is severely limited because you can't see patterns across populations. Consent becomes a nightmare: separate agreements for each organization, separate purposes, separate systems.
Governance becomes reactive. "We'll limit data sharing to comply with HIPAA." But that prevents longitudinal view. "We'll build an AI model." But it can't work on fragmented data. "We'll audit after something goes wrong." But by then, the patient is harmed.
This is the real constraint on healthcare AI. It's not model horsepower. It's not algorithmic sophistication. It's not data availability. It's governance. Nobody has built the infrastructure to own, govern, and reason about longitudinal patient data at scale in a way that's auditable, explainable, and clinically coherent.
How Knowledge Graphs Solve the Governance Problem
A knowledge graph inverts this. Instead of governance bolted on after the fact, governance becomes embedded in the architecture itself. A unified patient node in the KG has one source of truth, but access is granular: a care manager sees risk factors and outcomes, a researcher sees de-identified patterns, a regulator sees audit trails. Consent is tracked per edge, per purpose, per date. Data quality becomes visible because relationships are explicit—missing links highlight gaps immediately. Audit trails become comprehensive because every query, every change, every access is logged against a unified model.
The graph doesn't eliminate the need for HIPAA compliance or consent management. It makes those things possible at scale. Instead of six separate compliance problems, you have one governed structure where meaning is explicit, relationships are versioned, and accountability is clear.
That's what a knowledge graph solves.
Knowledge Graphs in Healthcare: Real Use Cases and Modern Platforms
Knowledge Graphs Are Already Operational in Healthcare
This is not theoretical. Large healthcare organizations are already using knowledge graphs to solve problems that traditional warehouses and standalone AI models struggle with.
Major payers have built enterprise-scale graphs linking claims, clinical data, providers, and members to identify high-risk patients earlier and intervene before costly events occur. Fraud investigators use graph analytics to detect coordinated provider and billing networks that would be invisible in tabular data, cutting investigation time and surfacing patterns rule-based systems miss. Some insurers have encoded medical necessity relationships into knowledge graphs to flag clinically inconsistent claims, augmenting traditional edits with contextual reasoning. Academic medical centers have combined patient data with biomedical knowledge graphs to prioritize rare diagnoses and uncover non-obvious treatment relationships.
The common pattern is not "graph as innovation project." It is graph as semantic backbone. Clinical data, claims, policies, and guidelines are linked in one governed structure where relationships are explicit, versioned, and queryable. Analytics, machine learning, and generative AI sit on top of that layer, retrieving grounded facts rather than improvising from fragmented data.
The shift underway is architectural. Knowledge graphs are moving from experimental tooling to core infrastructure, the layer that harmonizes meaning across systems. Warehouses aggregate. EHRs transact. AI predicts. The knowledge graph defines what is connected, what is allowed, and what is true.

Knowledge Graphs as Infrastructure, Not Innovation
What's shifting now is how organizations view knowledge graphs. They're moving from "special project" to essential infrastructure.
Modern data management platforms are beginning to embed knowledge graphs as a core service. SAP Business Data Cloud, for example, now offers knowledge graph capabilities integrated into their standard offering. Healthcare data platforms should look at leveraging similar offerings as part of their modern data architecture, alongside their data lakes, analytics platforms, and AI services.
This matters because it signals a fundamental shift in how healthcare IT is being built. For decades, the architecture was: raw data in systems of record, warehouses for reporting, separate AI and analytics on top. It was all disconnected.
The new model puts the knowledge graph in the middle. It becomes the semantic layer, the source of truth, the place where meaning is explicit. Clinical data goes in, gets harmonized, relationships are made explicit. Claims data goes in, gets linked to clinical context. Guidelines and policies go in as formal knowledge. Patient outcomes get connected to interventions.
From that unified graph, everything else flows: BI and analytics, AI and ML models, clinical decision support, fraud detection, quality measurement. The graph doesn't replace the warehouse or the EHR. It sits alongside them, but it provides something those systems can't: unified, governed, queryable, semantically rich representation of longitudinal patient reality.
Any hospital serious about trustworthy AI and longitudinal care should treat this as foundational infrastructure. Not as an add-on. As essential as your EHR or your billing system. Because without it, all the other AI and analytics will continue to run on fragmented, incomplete, ungoverned data. And fragmented data limits what's possible.
That's the future state. Not knowledge graphs as innovation. Knowledge graphs as infrastructure.


